
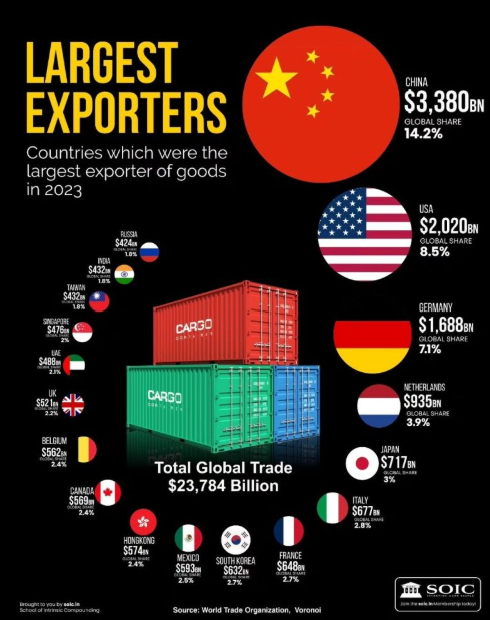
Largest Exporters in the World: How Global Trade Rankings Work
Which countries are the largest exporters in the world? The answer depends on what you count. A ranking of physical goods looks different from a ranking of commercial services, and both differ from a list that combines the two.
The World Trade Organization (WTO) reported that the current U.S.-dollar value of world merchandise exports reached about $26.26 trillion in 2025, up 7% from 2024. But that headline does not mean every exporter grew by the same amount, nor does it tell us how much value was created inside each country.
This guide explains the leading export economies, what they sell, and how to read trade rankings without drawing the wrong conclusion from a single number.
Largest merchandise exporters at a glance
WTO tables consistently place China, the United States, and Germany among the biggest merchandise exporters. Other economies frequently near the top include the Netherlands, Japan, South Korea, Italy, Hong Kong, France, and Mexico. The exact order and dollar values change with the reporting year, exchange rates, energy prices, and revisions.
| Economy | Why it ranks highly in merchandise exports | Important context |
|---|---|---|
| China | Large and diverse manufacturing base spanning electronics, machinery, electrical equipment, textiles, and consumer goods | Many exports contain imported components, so gross value is not the same as domestic value added |
| United States | Aircraft, machinery, energy products, chemicals, pharmaceuticals, vehicles, and agricultural goods | The U.S. is even more prominent when commercial services are included |
| Germany | Vehicles, industrial machinery, chemicals, pharmaceuticals, and precision manufacturing | Trade with other European Union members is included in standard country tables |
| Netherlands | Chemicals, machinery, refined products, food, and a major logistics and distribution role | Re-exports through Dutch ports can make gross exports large relative to the domestic economy |
| Japan | Vehicles, machinery, electronics components, and specialized industrial products | Exchange-rate movements can change its dollar ranking even when export volume changes less |
| South Korea | Semiconductors, electronics, vehicles, ships, chemicals, and batteries | Results can be sensitive to the global semiconductor cycle |
| Italy | Machinery, pharmaceuticals, vehicles, food, fashion, and other specialized manufactured goods | Its export base includes many small and midsize industrial firms |
| Hong Kong | Electronics and other goods moving through a major trading and logistics hub | A large share of reported exports are re-exports rather than locally produced goods |
| France | Aerospace, pharmaceuticals, luxury goods, machinery, chemicals, and food products | Services are also an important part of France’s international trade |
| Mexico | Vehicles, auto parts, electronics, machinery, medical devices, and other manufactured goods | Production is closely integrated with North American supply chains |
This is a guide to the economies commonly found near the top, not a frozen league table. For an exact year and methodology, use the WTO’s downloadable tables or merchandise trade dashboard.
Merchandise exports are not the same as total exports
Merchandise trade covers physical goods crossing borders: vehicles, food, oil, computers, medicines, clothing, and industrial equipment. Commercial services include areas such as travel, transport, finance, insurance, telecommunications, consulting, software, and charges for intellectual property.
A country can rank lower in goods but much higher in services. The United States is a major example because of its strength in business, financial, digital, and intellectual-property-related services. The United Kingdom, Ireland, India, Singapore, and other service-oriented economies also look different when services are counted.
Before sharing a “largest exporters” chart, check three labels:
- Does it cover goods, services, or both?
- Is the measure gross value in current U.S. dollars or trade volume?
- Does the ranking include trade within the European Union?
If those details are missing, countries can appear to be compared on the same basis when they are not.
Why China leads merchandise exports
China’s position reflects scale, infrastructure, dense supplier networks, manufacturing capability, and connections to buyers around the world. Its export base is much broader than low-cost consumer goods. It includes electrical equipment, machinery, computers, telecommunications equipment, batteries, solar products, vehicles, chemicals, and many intermediate inputs used by factories elsewhere.
However, the full customs value of an exported product is recorded as an export even when some components were imported. This is why economists also study trade in value added: it estimates how much value each economy contributes at different stages of a global supply chain.
Why the United States is a different kind of export power
The United States exports high-value manufactured goods, energy products, agricultural commodities, chemicals, medical products, and advanced equipment. It is also a leading exporter of services.
That distinction matters. Looking only at containers and factory goods understates the role of software, finance, business services, entertainment, research, licensing, and other knowledge-intensive activity. Merchandise and services tables should be read together when the goal is to understand an economy’s international reach.
Germany and Europe’s manufacturing networks
Germany’s export strength is tied to vehicles, industrial machinery, chemicals, pharmaceuticals, and specialized engineering. It also sits inside deeply integrated European supply chains. A component may cross borders several times before a final product reaches the customer.
Standard WTO country tables count trade between EU member states. Some analytical tables also show extra-EU trade or treat the European Union as a single trading bloc. Those presentations answer different questions and produce different rankings.
Why trading hubs can look unusually large
The Netherlands and Hong Kong illustrate the difference between domestic production and re-exports. Goods can enter a port or logistics hub and later leave for another destination with limited processing. Customs statistics still record the outward shipment as an export.
Re-exporting is real economic activity. It supports ports, warehousing, financing, distribution, and logistics. But it should not be interpreted as though the entire gross value was manufactured locally.
Five reasons export rankings change
1. Exchange rates
International rankings are usually expressed in U.S. dollars. If a country’s currency weakens against the dollar, its exports can fall in dollar terms even when local-currency revenue or physical shipment volume is stable.
2. Commodity prices
Oil, gas, metals, and food prices can move export values sharply. A commodity exporter may report higher dollar exports because prices rose, not because it shipped more.
3. The technology cycle
Demand for semiconductors, electronics, data-centre equipment, and consumer devices can accelerate or contract. This can materially affect technology-oriented exporters such as South Korea, Taiwan, China, Japan, and others.
4. Supply-chain relocation
Companies may diversify suppliers, move final assembly closer to customers, or redesign production around tariffs and industrial policy. Mexico and several Asian manufacturing economies have gained attention as supply chains evolve, but the pattern varies by product.
5. Reporting revisions
Trade data are updated as customs agencies and international organizations receive better information. A ranking copied from an early release may not match the final database.
Exports do not equal profit or national wealth
Gross exports measure the value of cross-border sales. They do not directly measure corporate profit, wages, productivity, household well-being, or the domestic content of those sales.
Consider a device assembled in one country using processors, displays, software, and materials from several others. The full export value may be assigned to the final shipping economy, even though value and income were created across the supply chain.
For a fuller picture, compare exports with:
- gross domestic product and exports per person;
- domestic value added in exports;
- export product and destination concentration;
- the trade balance, while remembering that a deficit is not automatically evidence of economic weakness;
- productivity, income, and employment; and
- the share of goods versus services.
How exports affect the global economy
Exports can support production, jobs, investment, and economies of scale. They also connect firms to new customers and expose them to international competition and ideas. Imports are the other half of the system: they give households and businesses access to products, energy, components, and equipment produced elsewhere.
That interdependence creates efficiency but also risk. A disruption at a major port, factory cluster, shipping route, or supplier can affect production in distant countries. Businesses therefore increasingly map critical suppliers, hold strategic inventory, qualify alternatives, and balance efficiency with resilience.
How to verify a largest-exporters claim
- Check the year. Publication date and reference year are often different.
- Check the category. Goods, services, and combined trade are not interchangeable.
- Check the unit. Current dollars, constant prices, volume indexes, and growth rates answer different questions.
- Check the geography. Determine whether Hong Kong is listed separately and whether EU internal trade is included.
- Check the source. Prefer the WTO, UN Trade and Development, UN Comtrade, or the country’s official statistics agency.
- Expect revisions. Record when you accessed a live database and avoid presenting provisional figures as final.
The bottom line
China, the United States, and Germany remain central to global merchandise trade, while economies such as the Netherlands, Japan, South Korea, Italy, Hong Kong, France, and Mexico regularly appear near the top of international goods-export tables.
The ranking alone is only a starting point. To understand what it means, separate goods from services, distinguish gross exports from domestic value added, and account for re-exports, exchange rates, commodity prices, and supply chains. A transparent definition is more useful than a dramatic but unlabeled top-10 chart.
Official sources
Related Posts
Previous Post
Next Post










Pingback: Terafab Vs TSMC Comparison Explained: 2026 Analysis